
Create stacked bar chart using Python 📊
Video Credit: Rumble - Duration: 01:57s - Published
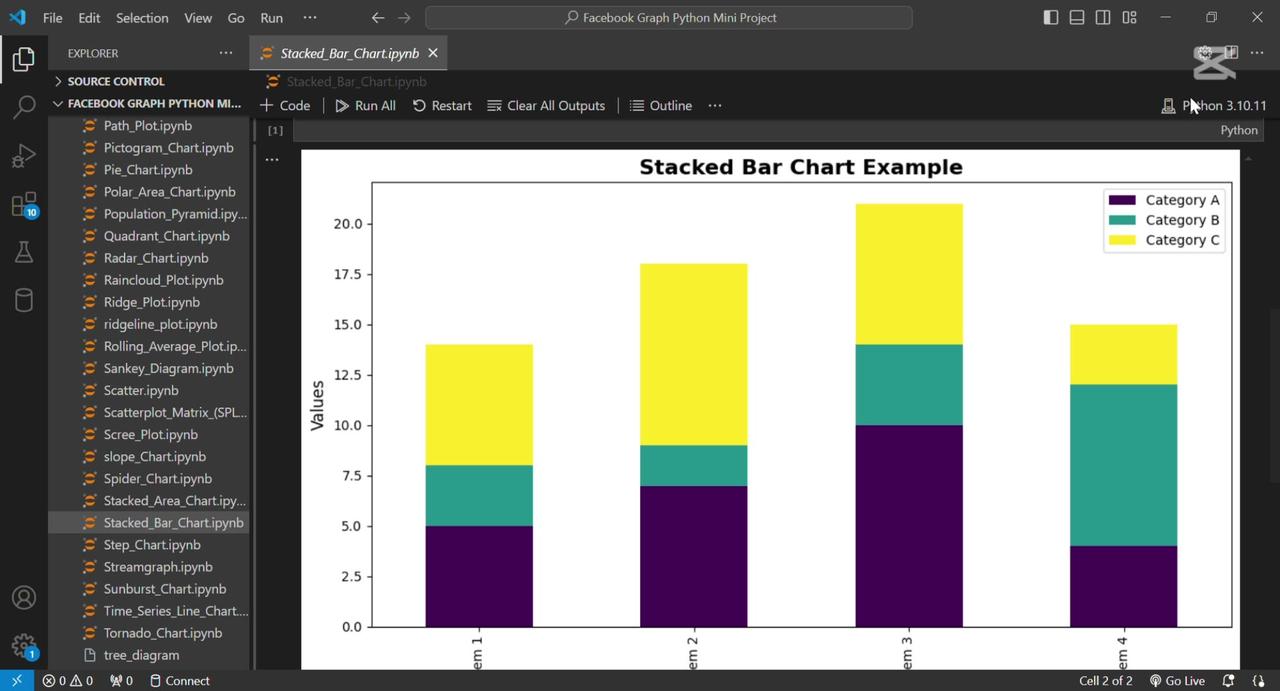
Create stacked bar chart using Python 📊
A stacked bar chart is used to display the composition of multiple categories in one bar, showing how each group contributes to the total.
In Python, this can be done using matplotlib, where bars are stacked by setting the bottom parameter.